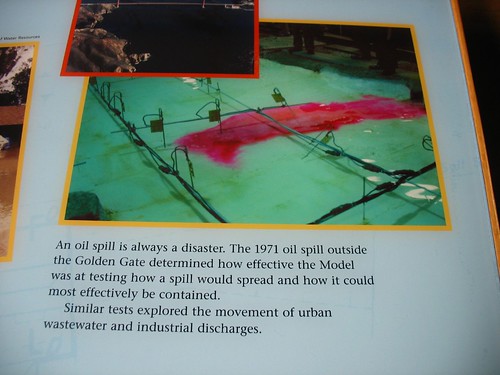
The U.S. Army Corps of Engineers built this concrete model of the San Francisco Bay-Delta system to test how possible land-use alterations might affect the Bay's hydrology. They also used it to model sediment flows, oil spills, et cetera.
The model was in service from 1957 until January 2000. Now Bay engineers use computers, and the Model is open to visitors.
In the 1940s an idea to dam and fill parts of the Bay put forth by "actor, theatrical producer, and schoolteacher" John Reber acquired widespread interest:
Under the plan, which was known as the San Francisco Bay Project or the Reber Plan, the Sacramento River mouth from Suisun Bay would be channelized by dams and would feed two freshwater lakes within the bay, providing drinking water to the residents of the Bay Area. The barriers would support rail and highway traffic and would create two vast freshwater lakes, supplying irrigation water to farms. Between the lakes, Reber proposed the reclamation of 20,000 acres (81 km²) of land that would be crossed by a freshwater channel. West of the channel would be airports, a naval base, and a pair of locks comparable in size to those of the Panama Canal. Industrial plants would be developed on the east.Link.
In 1953 the U.S. Army Corps of Engineers recommended more detailed study of the plan and eventually constructed a hydraulic model of the Bay Area to test it. The barriers, which were the plan's essential element, failed to survive this critical study. The scrapping of the Reber Plan in the early 1960's was one sign, perhaps, of the end of an era of grandiose civil works projects aimed at totally restructuring a region's natural environment, and the birth of the environmental era.
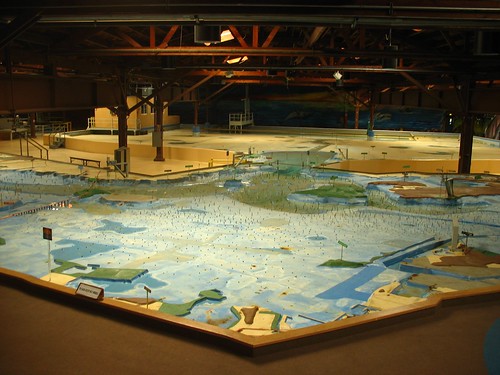
Constructed in two phases, starting in 1956, the Model consists of 286 slabs of concrete, each measuring 12-ft by 12-ft and weighing five-tons. The Model covers an area equivalent to two football fields.
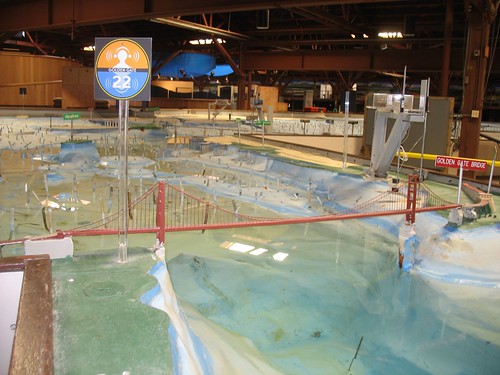
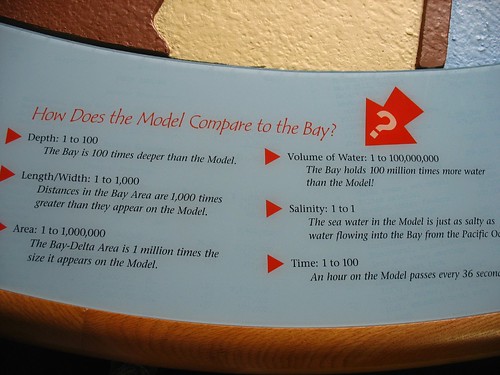
The model fills with water and replicates a 24-hour tidal cycle every 14.4 minutes. (The water was turned off during my visit.) An hour of real life passes every 36 seconds in the model. Two-thirds of the San Francisco Bay-Delta is less than 18 feet deep. In order for the Model to hold measurable amounts of water in its shallowest extremities, the model uses altered horizontal and vertical scales.
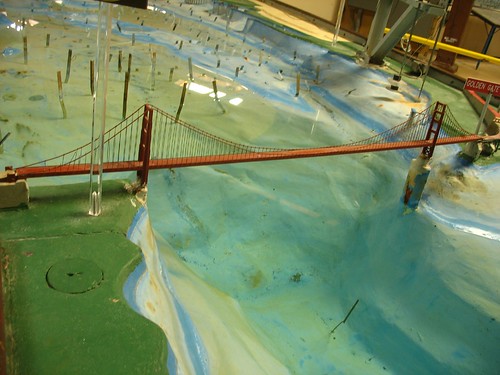
The deepest part of the Bay (330 ft) is right under the Golden Gate Bridge, where the largest amount of water passes through the narrowest strait.
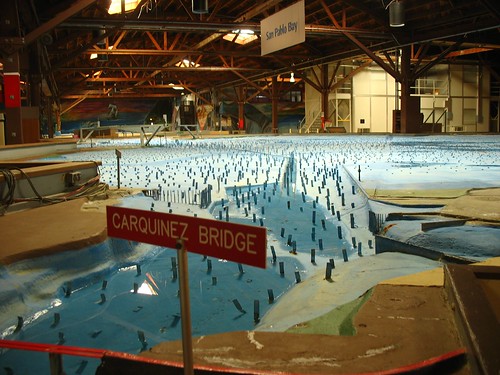
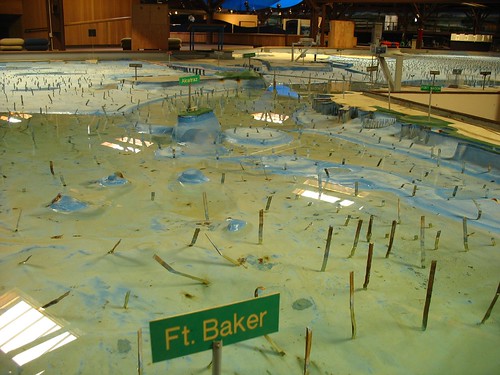
The copper tabs help to simulate friction between water and the Bay floor.
In the 19th century, gold miners diverted rivers to make water cannons that blasted away mountainsides. Downstream, the muddy debris raised rivers that flooded towns and farms, turned marshlands into uplands, and deposited deep layers of mud on the bottom of the Bay. Hydraulic mining was banned in 1884 by a federal court order.
An astonishing forty percent of California drains into San Francisco Bay; I dig this old-school model that shows the Sierra snowpack melting into rivers (which in real life are all dammed).
You can also see from this why the South Bay is the saltiest part of the Bay. All the freshwater flows in from the Delta and out through the Golden Gate, without much mixing. Freshwater inputs in the South Bay come mostly from treated wastewater.
Link to Ecology of San Francisco Bay Introduction and TOC.
2 comments:
Thanks, Chuck - I'd like to see this for real. I'll bet my dad would have liked to visit this exhibit, too. He was once bribed into taking a trip to Las Vegas by the promise of a side trip to Hoover Dam.
Annie at the Transplantable Rose
This is very interesting...I'm amazed that so much intelligent planning and forethought came in to play so long ago.
Post a Comment